sar コマンドの出力結果
# sar
Linux 3.10.0-957.1.3.el7.x86_64 (my.web.server) 	2018年12月24日 	_x86_64_	(3 CPU)

00時00分01秒     CPU     %user     %nice   %system   %iowait    %steal     %idle
00時10分01秒     all      0.01      0.00      0.01      0.00      0.00     99.97
00時20分01秒     all      2.03      0.00      0.36      0.09      0.00     97.51
00時30分01秒     all      1.09      0.00      0.23      0.05      0.00     98.63
00時40分01秒     all      0.55      0.00      0.13      0.03      0.00     99.29
00時50分01秒     all      0.34      0.00      0.10      0.02      0.00     99.55
(以下略)
から、時間と %iowait の値を抽出して、R へ渡す。
「0時00分01秒」と、漢字が邪魔なので、
LANG を変更する。
# LANG=C; sar
Linux 3.10.0-957.1.3.el7.x86_64 (my.web.server) 	12/24/18 	_x86_64_	(3 CPU)

00:00:01        CPU     %user     %nice   %system   %iowait    %steal     %idle
00:10:01        all      0.01      0.00      0.01      0.00      0.00     99.97
00:20:01        all      2.03      0.00      0.36      0.09      0.00     97.51
00:30:01        all      1.09      0.00      0.23      0.05      0.00     98.63
00:40:01        all      0.55      0.00      0.13      0.03      0.00     99.29
00:50:01        all      0.34      0.00      0.10      0.02      0.00     99.55
1行目から年月日情報を取得し、1列目に加える。
時分秒列(1列目)と%iowait列(6列目)が、数値から始まる行から、時分秒列と%iowait列を、2列目・3列目として抽出する。
csvとしてファイルへ記入する。
# LANG=C;sar | awk 'BEGIN{OFS=","}NR==1{DAY=$4}$1~/^[0-2]/&&$6~/^[0-9]/{print DAY,$1,$6}' > sar_iowait
# head sar_iowait
12/24/18,00:10:01,0.00
12/24/18,00:20:01,0.09
12/24/18,00:30:01,0.05
12/24/18,00:40:01,0.03
12/24/18,00:50:01,0.02
12/24/18,01:00:01,0.02
12/24/18,01:10:01,0.02
12/24/18,01:20:01,0.02
12/24/18,01:30:01,0.01
12/24/18,01:40:01,0.02
今日のデータだと24時間分ないので、前日のデータを取得することにする。
# LANG=C;sar -f /var/log/sa/sa$(date +"%d" --date "1 day ago")| awk 'BEGIN{OFS=","}NR==1{DAY=$4}$1~/^[0-2]/&&$6~/^[0-9]/{print DAY,$1,$6}'  > sar_iowait
# head sar_iowait
12/23/18,00:10:01,0.00
12/23/18,00:20:01,0.00
12/23/18,00:30:01,0.02
12/23/18,00:40:01,0.01
12/23/18,00:50:01,0.00
12/23/18,01:00:01,0.00
12/23/18,01:10:01,0.00
12/23/18,01:20:01,0.09
12/23/18,01:30:01,0.02
12/23/18,01:40:01,0.01
R でデータファイルを読み込む。
> library(readr)
> sar_iowait <- read_csv("~/ssh/sar_iowait",
+                        col_names = c("年月日", "時分秒", "%iowait"),
+                        col_types = cols(年月日 = col_date(format = "%m/%d/%y"),
+                                         時分秒 = col_time(format = "%H:%M:%S")))
> sar_iowait
# A tibble: 143 x 3
   年月日     時分秒 `%iowait`
   <date>     <time>     <dbl>
 1 2018-12-23 00:10       0
 2 2018-12-23 00:20       0
 3 2018-12-23 00:30       0.02
 4 2018-12-23 00:40       0.01
 5 2018-12-23 00:50       0
 6 2018-12-23 01:00       0
 7 2018-12-23 01:10       0
 8 2018-12-23 01:20       0.09
 9 2018-12-23 01:30       0.02
10 2018-12-23 01:40       0.01
# ... with 133 more rows
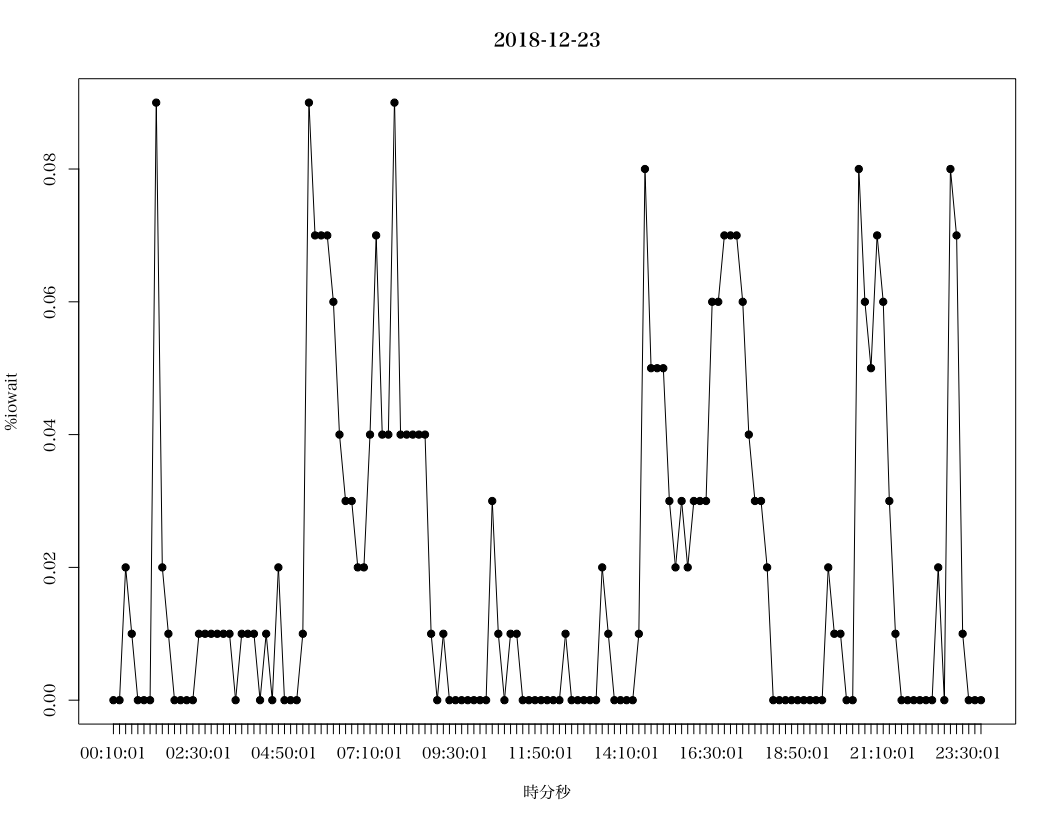
グラフを描く。
そのままだとX軸目盛りが時分秒にならないので、axis() で追加している。
> plot(sar_iowait[,2:3], type="o", pch =19, xaxt = "n", ylab = "%iowait", main = sar_iowait$年月日[1])
> axis(1, at = sar_iowait$時分秒, labels = sar_iowait$時分秒)
基本統計量
> summary(sar_iowait$`%iowait`)
   Min. 1st Qu.  Median    Mean 3rd Qu.    Max.
0.00000 0.00000 0.01000 0.02028 0.03000 0.09000
Comments